Simulation software. No real orders. Not trading advice.
A desktop replay terminal for MES futures.
Replay any session, trade it on paper, read the order flow, and test your own rules over years of bars. All in one window.
One email when it opens. No card needed. Planned price: $99, one-time.
- 1.4Mone-minute MES bars loaded in these screenshots
- Real trades and order bookon the days that have that data
- Your rules, in JavaScripttested over the full history
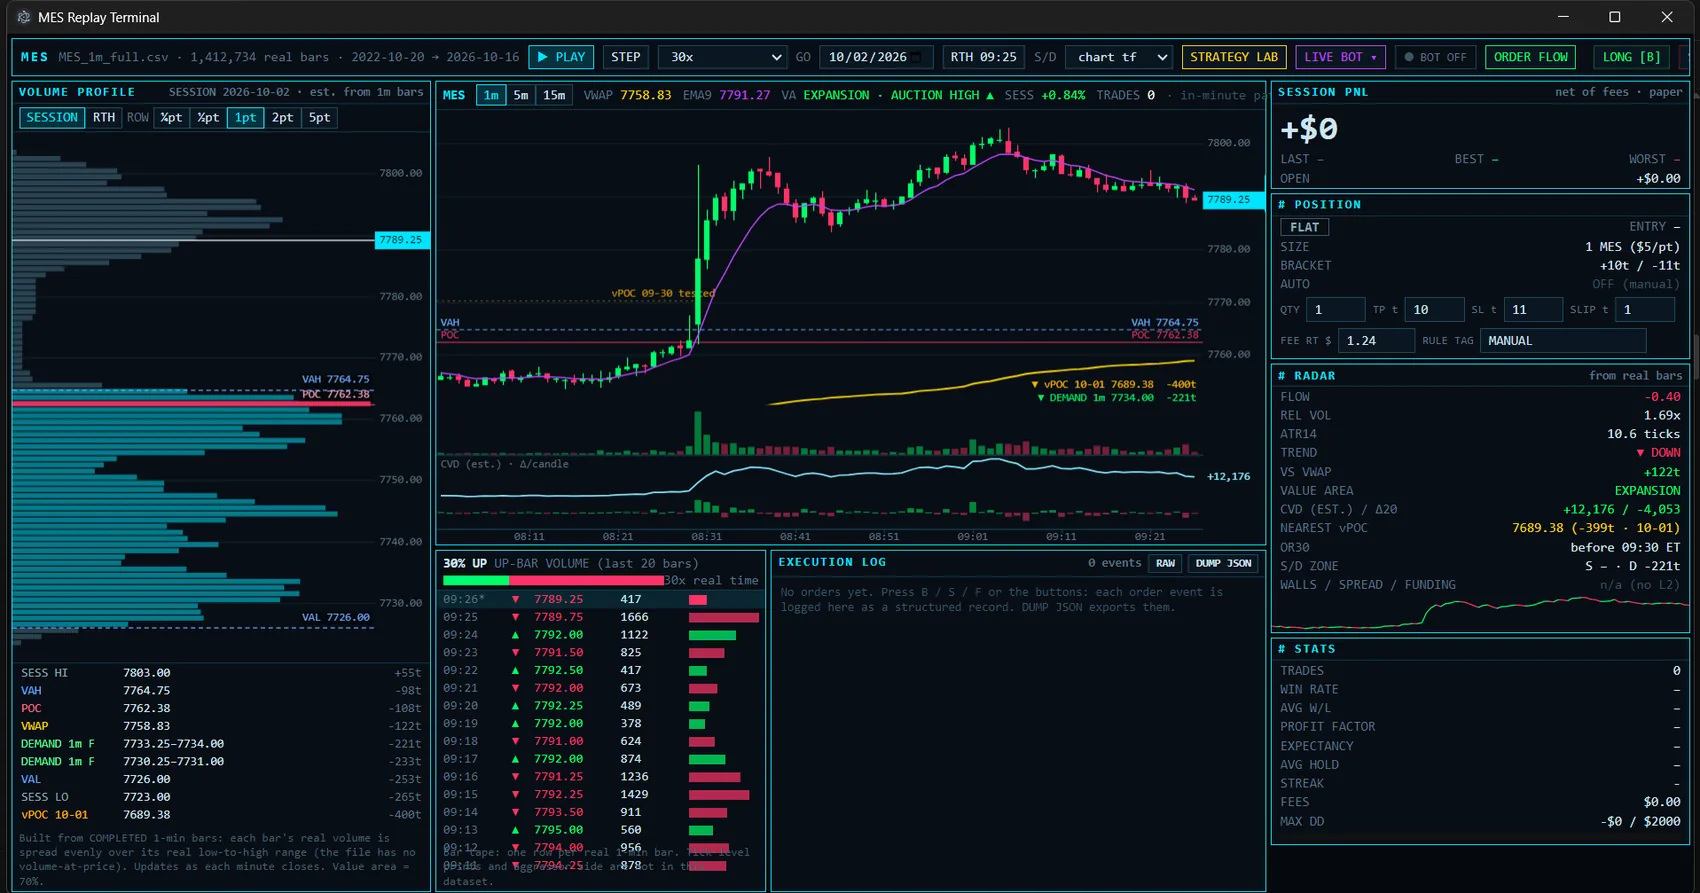
Learn it on replay. Not on a paid evaluation.
A live chart gives you one pass at each session and no rewind. Replay gives you the same session as many times as you need. The Strategy Lab shows whether a rule held up on data it was not tuned on.
On a live chart
One look at each setup. If your stop was too tight, you find out with money on the line, and you cannot go back and try a wider one.
In replay
Rewind the same morning. Change the stop, the size or the entry and see what changed. Then run the rule over the whole dataset instead of one week.
Five steps. One window.
What a session looks like. Every screenshot on this page is the real app.
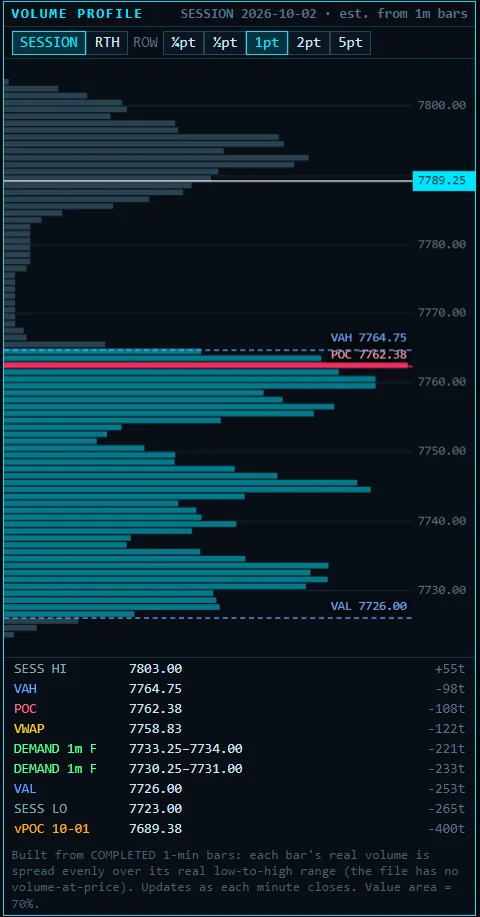
Read the session first.
A volume profile with the point of control, value area high and low, VWAP, session high and low, and the nearest prior-day volume POC, all with distance in ticks.
- Session or RTH profile, from half-point to 5-point rows
- Profile is estimated from 1-minute bars and labeled "est." in the app
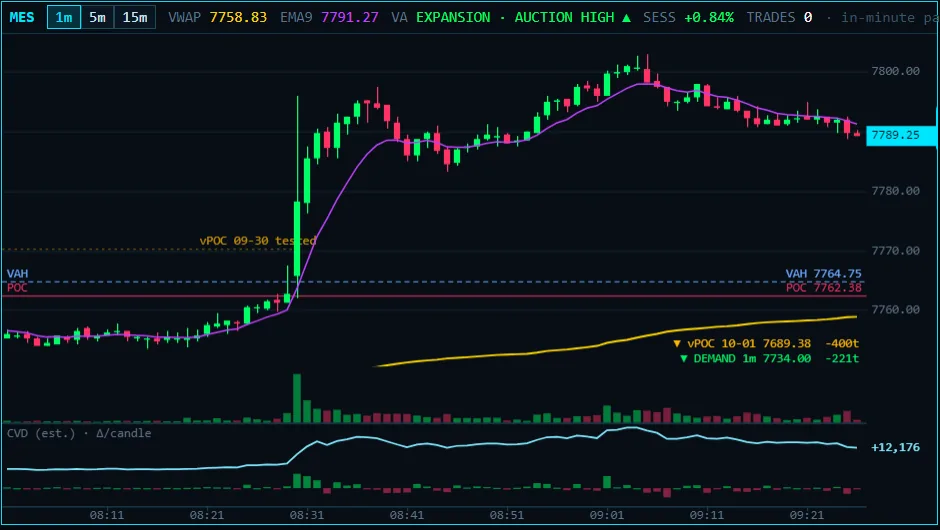
Replay it at your speed.
Play the day at up to 30x or step one bar at a time. Jump to any date in the dataset. VWAP, EMA, value-area levels and demand zones draw on the chart as the session unfolds.
- 1-minute, 5-minute and 15-minute views
- Pause, step, or restart the day
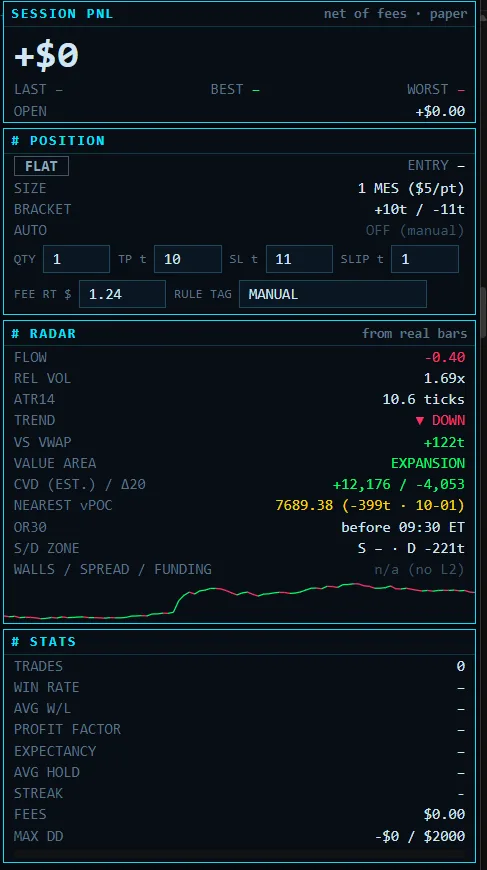
Place the trade on paper.
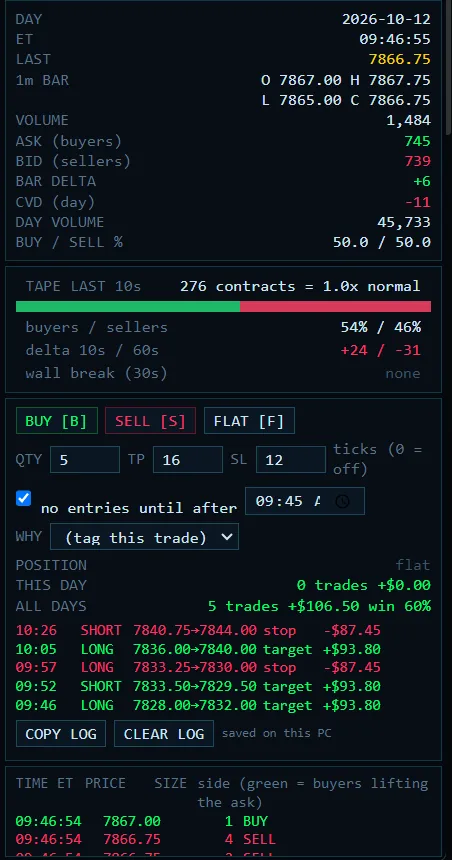
Buy, sell or flatten with hotkeys. Set take-profit and stop in ticks, with slippage and a fee per round trip, so the P&L you see is after costs.
- Session P&L, win rate, profit factor and drawdown update live
- Every order is logged as a structured record you can export
See what the book was doing.
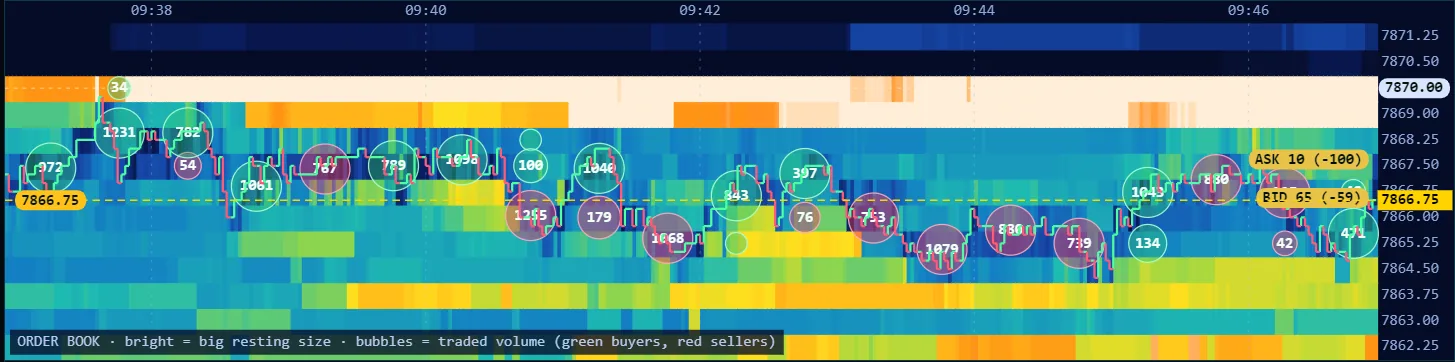
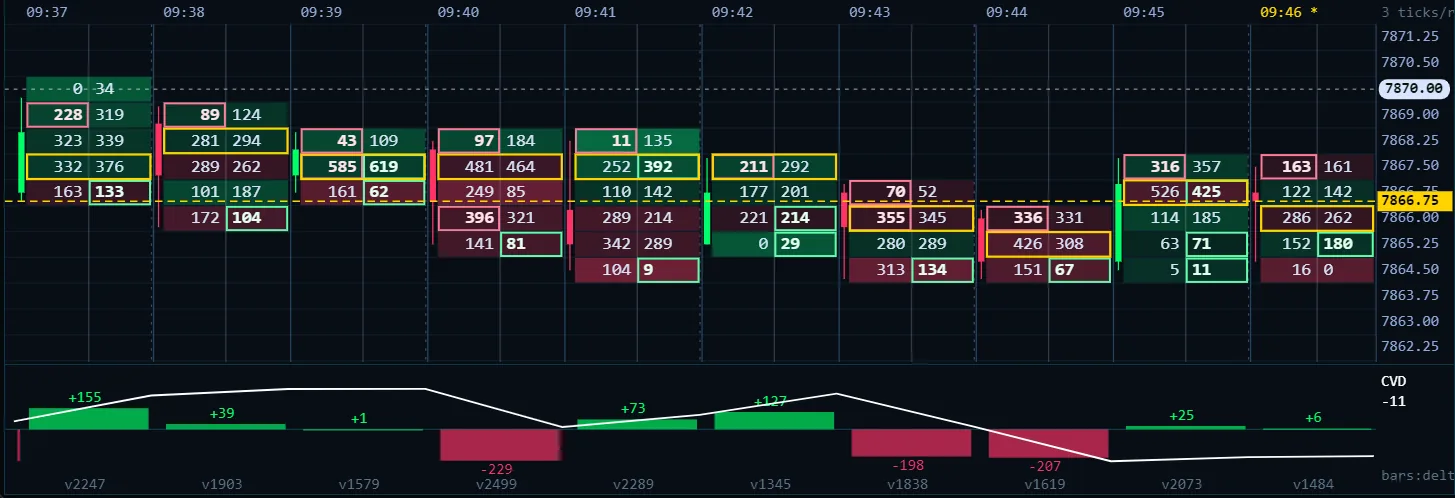
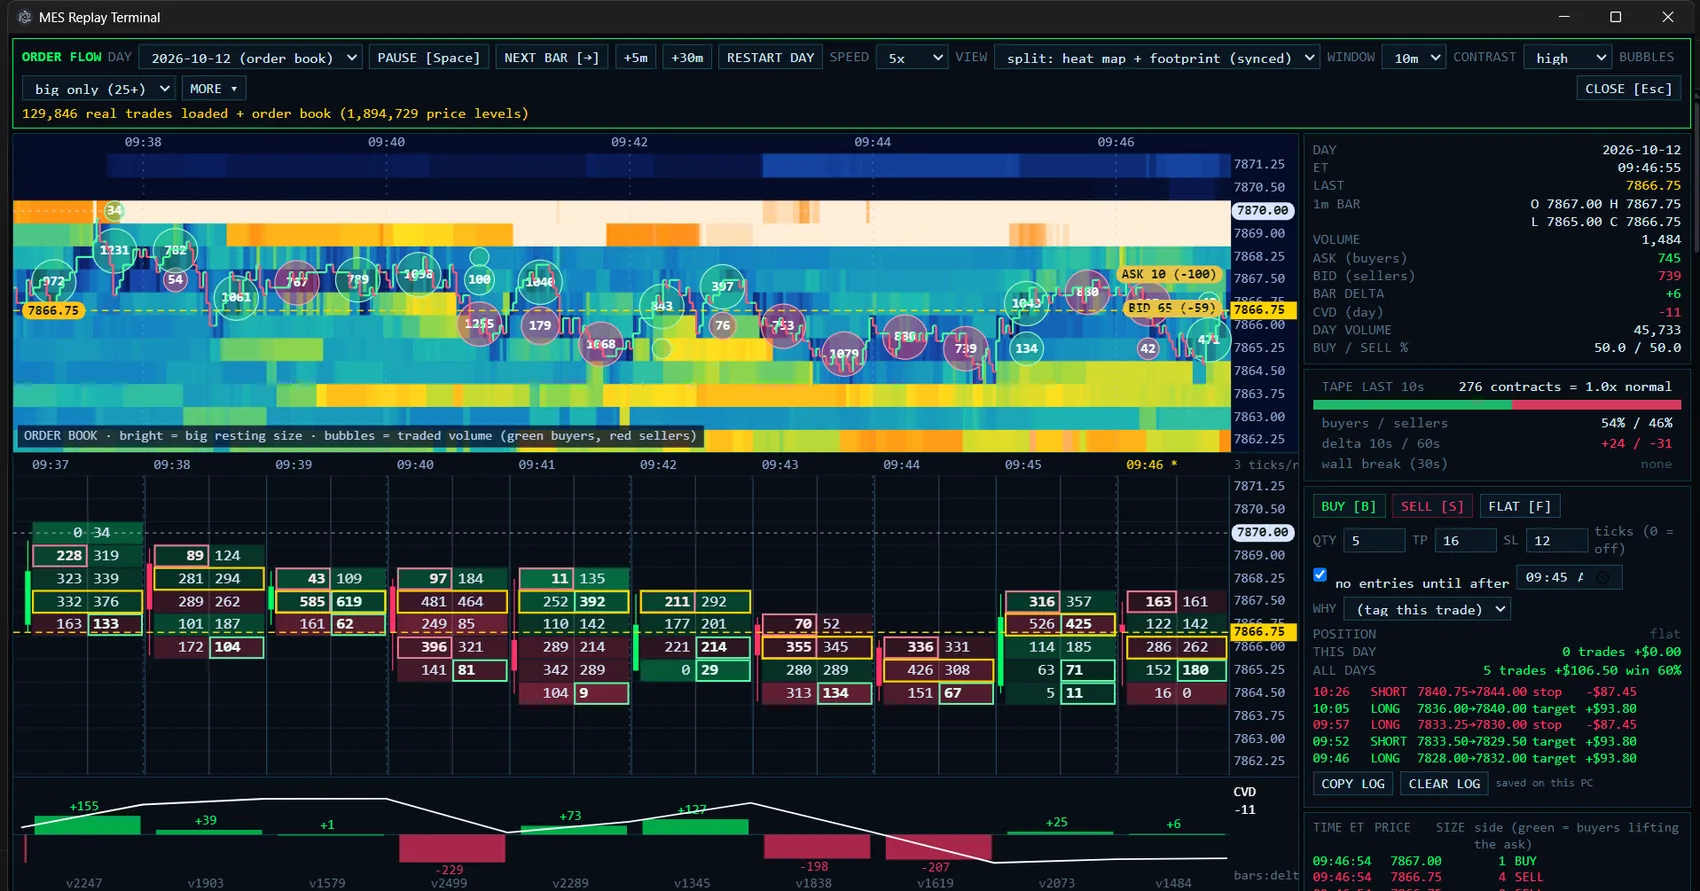
On days loaded with real trades and order book depth, switch to Order Flow. Resting size shows as a heat map, traded volume as bubbles, and the footprint and tape sit on the same time axis.
- Filter to big prints only
- Delta, CVD, and tape speed on the side panel
- One loaded day shows 129,846 real trades and 1.89 million price levels
Test the rule on years of bars.
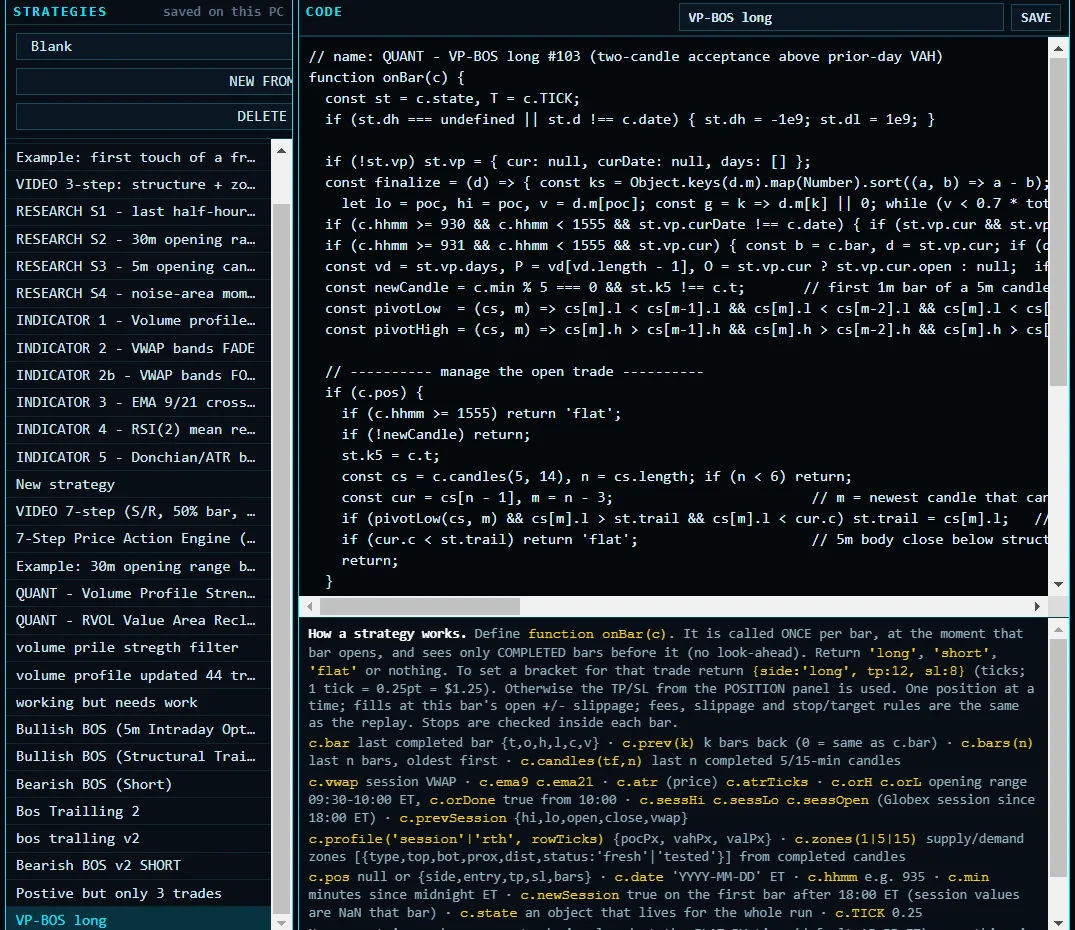
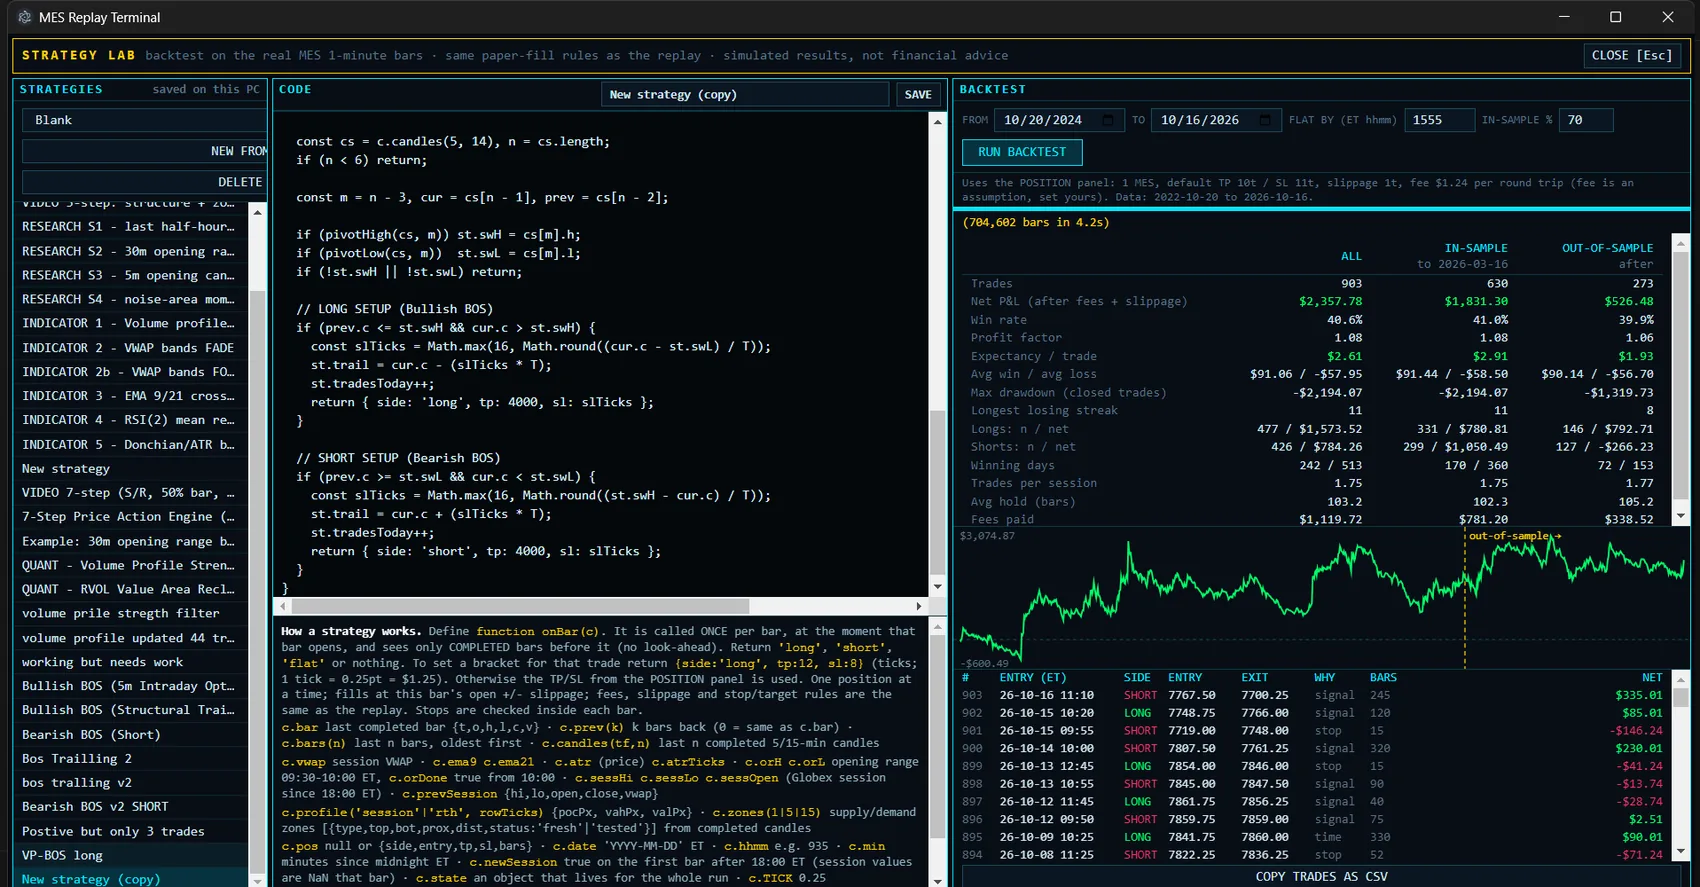
Write a rule in plain JavaScript, run it over the full history, and read the result after fees and slippage. Stats are split into in-sample and out-of-sample, so you can see whether it held up on data it was not tuned on.
- Win rate, profit factor, expectancy, drawdown, longest losing streak
- Copy the trade list as CSV
- Strategies are saved on your computer
Every screen, unedited.
Real captures of the app. Tap any image to enlarge.
Where it fits. Where it does not.
Larger platforms do more, and several have free tiers or trials. Here is the honest comparison.
| Prop Desk Tool | Typical full platform | |
|---|---|---|
| Data resolution | 1-minute bars, plus real trades and order book on loaded days | Often tick-level for the whole history |
| Order flow | Real heat map, footprint and tape on loaded days. Volume profile in the main view is estimated from bars. | Real tape and footprint across most sessions |
| Strategy testing | Built into the replay. JavaScript rules, in-sample and out-of-sample split. | Usually a separate tool or its own scripting language |
| Live trading | No. Practice and testing only. [NEEDS REVIEW] | Often yes |
| Setup | Install and load your data | Account, data subscription, configuration |
Choose Prop Desk Tool for fast, focused practice and rule testing on MES. Choose a full platform if you need live execution or tick data for every session.
Built for a narrow job.
Built for
- Traders preparing for a futures prop-firm evaluation
- Self-directed MES day traders who want to rehearse setups
- People who write rules and want a fast backtest loop
Not for
- Anyone looking for trade signals
- Live trading or broker connections
- Anyone hoping for a promise of profit. It is practice and testing only.
Why I built it
I built this tool because I could not find anything out there that had what I needed. So I built it myself.
Straight answers.
Is this real trading?
No. Everything is simulated. Results in replay or the Strategy Lab do not predict real trading results.
What does it cost?
Planned launch price: $99, one time. No subscription. People on the early-access list get it first, with the launch details. For context, replay and backtesting subscriptions we checked on 2026-11-03 run from about $15 to $60 a month, and there are no refunds, so look through the screenshots first. [NEEDS REVIEW: Evans to confirm $99]
Is the order flow real?
The Order Flow view uses real trades plus order book depth on days where that data is loaded. The volume profile and delta in the main view are estimated from 1-minute bars and labeled "est." in the app.
Where does the market data come from?
You bring your own historical MES data from a source you are licensed to use. [NEEDS REVIEW: confirm before launch]
Where are my strategies and logs kept?
Strategies and order logs are saved on your computer.
Windows or Mac?
[NEEDS REVIEW: list the platforms you have tested]
Will it help me pass a prop-firm evaluation?
It is a practice tool. It cannot promise a pass, and it is not affiliated with any prop firm.
Refunds?
No. All sales are final, so look through the screenshots and this FAQ before you buy. Everything shown on this page is the real app.
Is this the same as the Prop Desk Trading game?
No. Prop Desk Trading is a separate simulator game that is free to play in the browser. This is a desktop tool for MES replay and rule testing. Early-access buyers also get the full game included. [NEEDS REVIEW]
One price. No subscription.
Planned launch price
- Included: the MES replay terminal, Order Flow view and Strategy Lab
- Also included: Prop Desk Trading, the full game, free. Listed at $14.99 for everyone else [NEEDS REVIEW: list the paid game at $14.99 before launch and define what the paid version adds]
- Not included: market data. You bring your own historical MES data. [NEEDS REVIEW: confirm data source]
- Runs on: [NEEDS REVIEW: Windows / Mac]
- A free browser version of the game is available today on itch.io
All sales are final, so look through the screenshots and the FAQ first. Everything on this page is the real app.
Join the list and you get the launch email first.
Simulation software. Trading futures involves substantial risk of loss.